ELK Stack Retrospective
For the past six months or so, I’ve been running an ELK stack setup in our hosting infrastructure at work to monitor, among other things:
- HTTP requests coming in
- Nginx response times
- System loads
- Sendmail and Postfix activity
- Disk IO and related metrics
To do this, I’ve had to evolve the infrastructure somewhat. Here’s a brief overview of what happened.
v1
- Logstash was installed on a single box using its built-in Elasticsearch server to store data.
- Each host I wanted to monitor had a local instance of Logstash installed on it and configured manually to send events to the indexer.
- The indexer processed the events and stored them in ES.
v2
I quickly realised that this wouldn’t work in the long-term as event rates increased and a single box couldn’t handle the load of indexing and storing the logs in ES. So, I
- Commissioned a new, dedicated ES instance to store the data and added it to the cluster that Logstash was running on its own.
- Once the shards had replicated, I shut down the LS internal Elasticsearch instance and reconfigured LS to write to the dedicated ES cluster (of one device)
- In addition, I replaced the Logstash instances on the client nodes with a lighter-weight Lumberjack/Logstash-forwarder instance. LSF is built in Go and will run on any platform with minimal requirements, unlike Logstash proper which needs a JVM and is much more memory-intensive.
v3
The setup above was good, but it lacked two things that would be needed in a production environment:
- Resilience/availability
- Scalability
The main problem was that while the lumberjack instances would queue up events to a certain point, restarting the main Logstash indexer process would cause lost events and load would jump through the roof as soon as the LS process restarted.
Logstash is capable of using Redis or another message queue to handle variable event rates, so I set up a “logstash relay” box which ran a simple, lightweight instance of LS with minimal configuration (no event processing, just forwarding) which dumped everything into Redis and LS1 (the indexer) would then connect to the Redis instance and grab events off the queue to process them.
This system worked pretty well for a time until several lumberjack/LSF agents went crazy and started dumping millions of events into the queue from old log files that they decided to parse. This was a Bad Thing because Redis writes its queue to disk by default and when it runs out of disk space, there is no easy way (that I knew of at the time) to throttle incoming events. This ends up crashing the Redis instance and stops the relay dead.
So, some further re-architecture was done.
v4
The current incarnation of the ELK stack looks like this
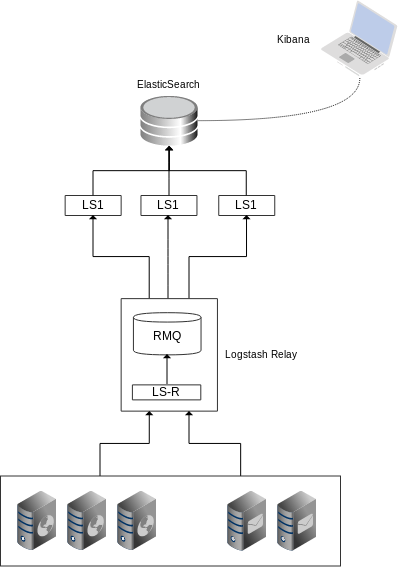
The main change was that I replaced Redis with RabbitMQ. RMQ is much “heavier” than Redis, but it is also more manageable, configurable and, crucially, it will look after itself and ensure that if it runs out of memory and/or disk space, upstream clients will be blocked or throttled until such a time that disk space falls below the warning threshold and events can be written to the queue once more.
This means that the LS relay instance can be made to not accept events from client nodes because it’s aware that it’s being throttled by RMQ. This wasn’t the case with Redis, as LS was attempting to blindly dump events into Redis and failing.
Performance Notes
Here are some recommendations for building out a resilient ELK stack
Elasticsearch
- Memory. ES loves memory. The more RAM you give you ES instances, the better they’ll perform.
- Set your Java heapsize to 50% of available RAM for ES – so if you have 24GB RAM, set the heap size to 12GB.
- Storage: the faster your disks, the better ES does, especially as event rates climb and it’s having to index several thousand records a second.
Logstash
- CPU. You need lots of CPU and as little contention as possible. Depending on just how much processing you’re doing using Grok and other filters, the LS workers can become saturated and if your CPU is being stressed already, LS is likely to lock up and fail very un-gracefully.
- You will need to balance fine-grained analysis of your events with CPU use.
- Playing with the number of workers that LS starts can give you a boost in event rate at the cost of using more CPU. To set this, edit /etc/default/logstash (in Debian) and set the following: LS_OPTS=“-w 6”
Change 6 to whatever number of workers you want. You can experiment with this value to find the sweet spot between event rate and CPU use.
- You can also use this command to get a good overview of what LS is up to. alias lstop=‘top -Hp cat /var/run/logstash.pid‘
Once you run that, you’ll be able to issue ‘lstop’ from your comandline and get a quick view of all the LS processes. If you begin to see many |worker processes constantly in bold and with high CPU use, you’re looking at the CPU being saturated and may need to back off the filtering or the number of workers or both
Hopefully this helps those of you who are playing with LS and are looking to improve your infrastructure. Let me know in the comments if you have any ideas of your own.